Frequently Asked Questions
Where are Babel, ESLint and stylelint configured?
In package.json
Where are the files coming from when I run npm start?
In development Webpack compiles your application runs it in-memory. Only when
you run npm run build will it write to disk and preserve your bundled
application across computer restarts.
How do I fix Error: listen EADDRINUSE 127.0.0.1:3000?
This simply means that there's another process already listening on port 3000.
The fix is to kill the process and rerun npm start.
OS X / Linux:
-
Find the process id (PID):
ps aux | grep nodeThis will return the PID as the value following your username:
janedoe 29811 49.1 2.1 3394936 356956 s004 S+ 4:45pm 2:40.07 node server -
Then run
kill -9 YOUR_PIDe.g. given the output from the example above,
YOUR_PIDis29811, hence that would mean you would runkill -9 29811
Windows
-
Find the process id (PID):
netstat -a -o -nThis will return a list of running processes and the ports they're listening on:
Proto Local Address Foreign Address State PID TCP 0.0.0.0:25 0.0.0.0:0 Listening 4196 ... TCP 0.0.0.0:3000 0.0.0.0:0 Listening 28344 -
Then run
taskkill /F /PID YOUR_PIDe.g. given the output from the example above,
YOUR_PIDis28344, hence that would mean you would runtaskkill /F /PID 28344
Local webfonts not working for development
In development mode CSS sourcemaps require that styling is loaded by blob://, resulting in browsers resolving font files relative to the main document.
A way to use local webfonts in development mode is to add an absolute output.publicPath in webpack.dev.babel.js, with protocol.
// webpack.dev.babel.js

output: {
  publicPath: 'http://127.0.0.1:3000/',
  /* … */
},
Non-route containers
Note: Container will always be nested somewhere below a route. Even if there's dozens of components in between, somewhere up the tree will be route. (maybe only "/", but still a route)
Where do I put the reducer?
While you can include the reducer statically in reducers.js, we don't recommend this as you lose
the benefits of code splitting. Instead, add it as a composed reducer. This means that you
pass actions onward to a second reducer from a lower-level route reducer like so:
// Main route reducer

function myReducerOfRoute(state, action) {
  switch (action.type) {
    case SOME_OTHER_ACTION:
      return someOtherReducer(state, action);
  }
}
That way, you still get the code splitting at route level, but avoid having a static combineReducers
call that includes all of them by default.
See this and the following lesson of the egghead.io Redux course for more information about reducer composition!
How do I run the saga?
Since a container will always be within a route, one we can simply add it to the exported array in
sagas.js of the route container somewhere up the tree:
// /containers/SomeContainer/sagas.js

import { someOtherSagaFromNestedContainer } from './containers/SomeNestedContainer/sagas';

function* someSaga() { /* … */ }

export default [
  someSaga,
  someOtherSagaFromNestedContainer,
];
Or, if you have multiple sagas in the nested container:
// /containers/SomeContainer/sagas.js

import nestedContainerSagas from './containers/SomeNestedContainer/sagas';

function* someSaga() { /* … */ }

export default [
  someSaga,
  ...nestedContainerSagas,
];
Using this boilerplate with WebStorm
WebStorm is a powerful IDE, and why not also use it as debugger tool? Here is the steps
- Install JetBrain Chrome Extension
- Setting up the PORT
- Change WebPack devtool config to
source-map(This line) - Run web server (
npm run start) - Create Run Configuration (Run > Edit Configurations)
- Add new
JavaScript Debug - Setting up URL
- Start Debug (Click the green bug button)
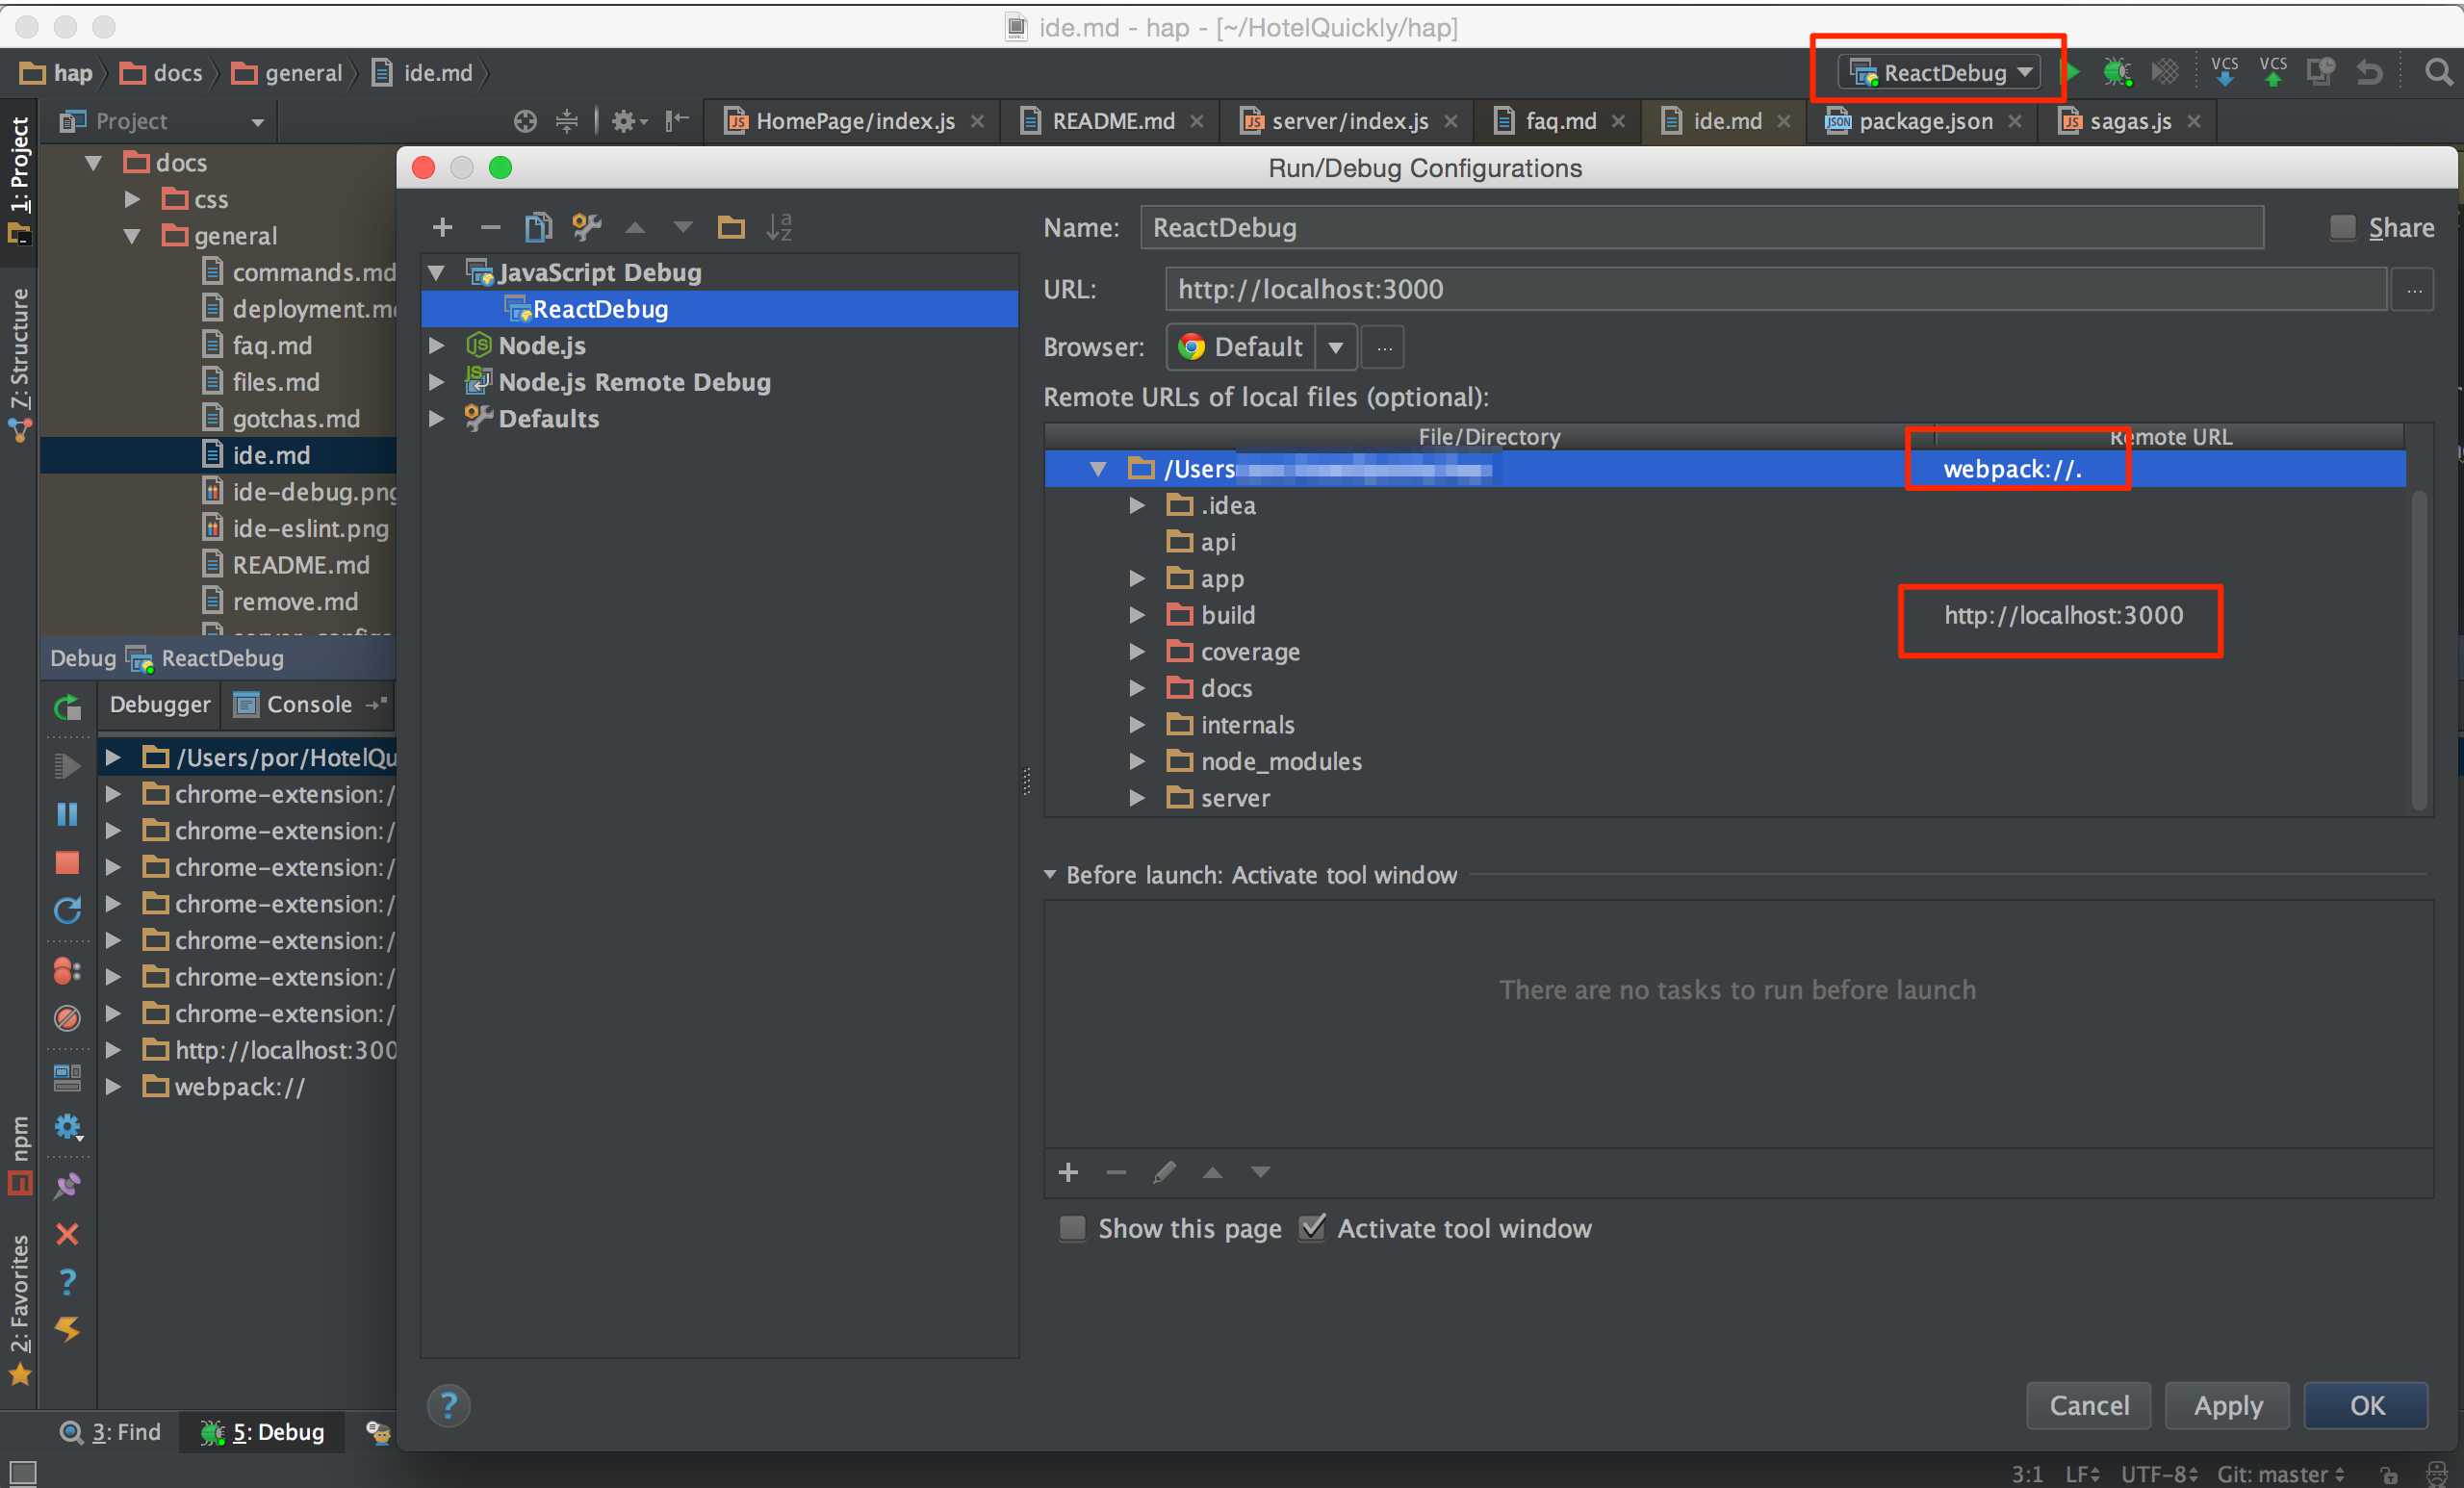
- Edit Run Configuration Again
- Mapping Url as below picture
* Map your `root` directory with `webpack://.` (please note the last dot)
* Map your `build` directory with your root path (e.g. `http://localhost:3000`)
- Hit OK and restart debugging session
Troubleshooting
- You miss the last
.(dot) inwebpack://. - The port debugger is listening tool and the JetBrain extension is mismatch.
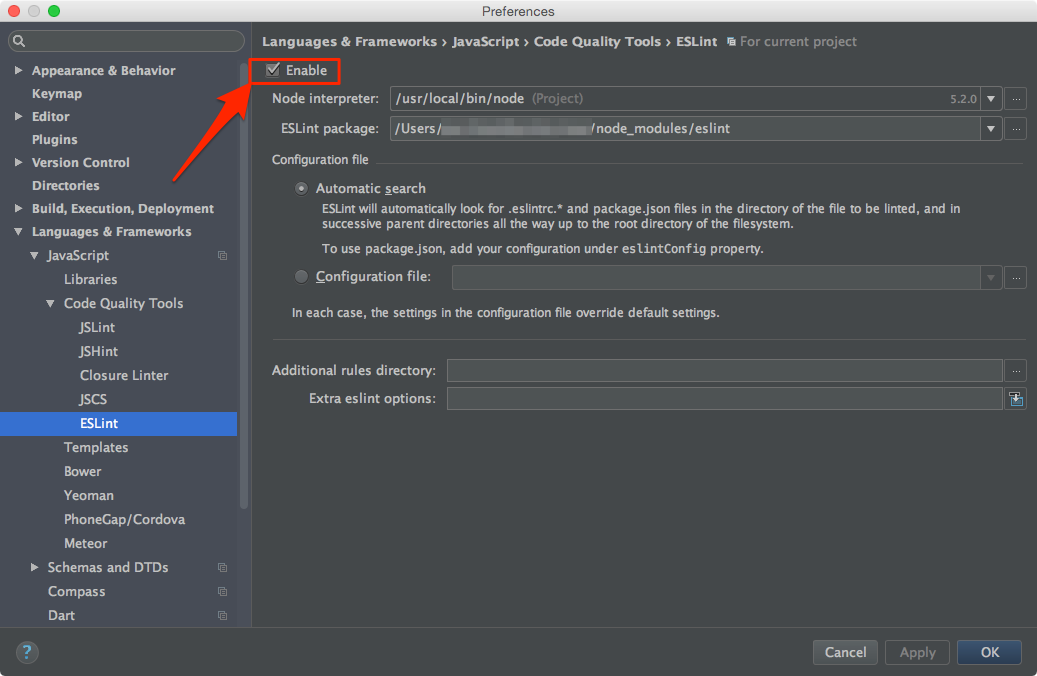
Enable ESLint
ESLint help making all developer follow the same coding format. Please also setting up in your IDE, otherwise, you will fail ESLint test.
- Go to WebStorm Preference
- Search for
ESLint - Click
Enable